On Wednesday morning, a person reading the financial pages could have encountered two facts about the American economy within sixty seconds of each other. The first: the S&P 500 had climbed back to a record high, erasing every dollar lost during the panic over Iran. The second: the University of Michigan’s Consumer Sentiment Index had fallen to 47.6, the lowest reading in the survey’s seventy-four-year history.
Record high and record low, same week. Two measurements of the same country, arriving at conclusions so far apart they might as well have been measuring different planets.
Wall Street called it the “most hated rally.” That phrase is worth sitting with. A rally so disconnected from the national mood that even the people profiting from it can feel something wrong with it. The financial press has a term for this kind of dissonance. Regular people don’t need a term for it. They just know.
The gap between what the market says and what Americans feel has been growing for a long time. It didn’t start this week. It didn’t start with Iran or with any particular president. If you’ve been paying attention since the early 1990s, you can trace the two lines diverging slowly, then faster, until the charts don’t look like they belong in the same report.
I covered the 2008 financial crisis from Cincinnati. Not from a trading floor or a policy desk, but from the neighborhoods where people’s retirements disappeared overnight. What struck me then, and has stayed with me since, was the sequence of events afterward. The market recovered. It recovered fairly quickly, in historical terms. By 2013, the S&P was back above its pre-crisis peak. The people I’d written about in Norwood and Price Hill and Middletown had not recovered. Their houses were still underwater. Their pensions were still diminished. Their towns still had empty storefronts where businesses used to be.
Nobody lied about the market’s recovery. The numbers were real. But the numbers were answering a question that most Americans weren’t asking.
This week’s version of that split arrived with a specificity that deserves attention. The Michigan survey didn’t just decline. It declined across every demographic group the survey measures. Every age bracket. Every income level. Every political affiliation. Democrats reported a sentiment reading of 31.8. Republicans, 87.1. Both had fallen ten points since February. The starting positions were different. The direction was the same.
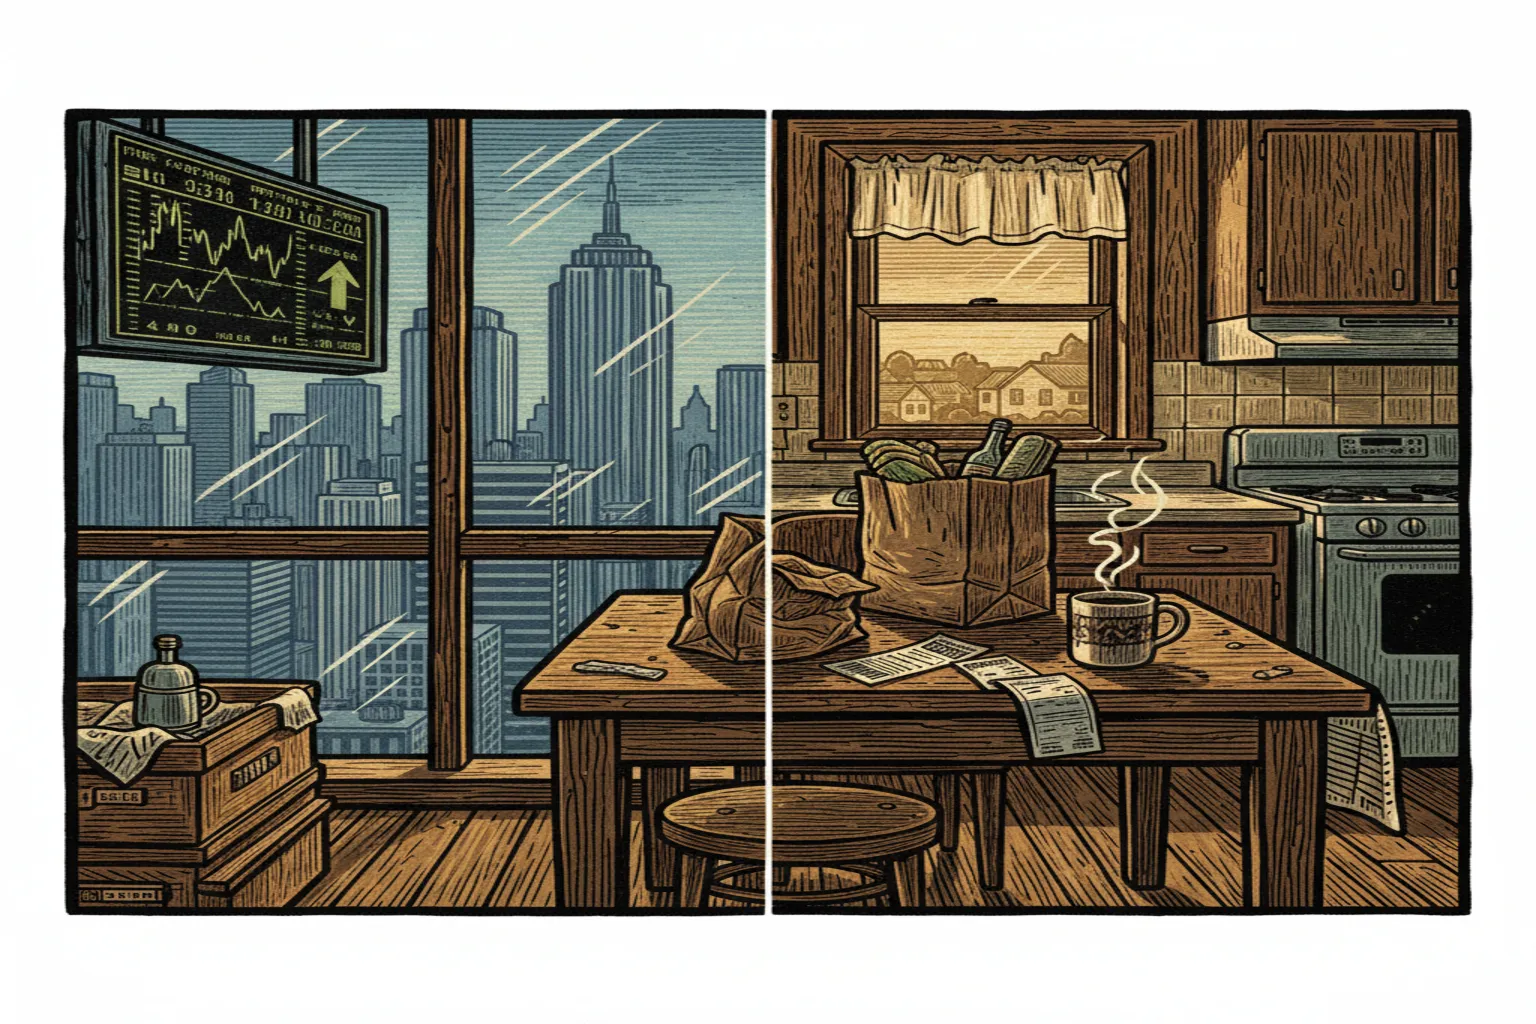
When every group in the country is moving the same way on a question about how the economy feels, that isn’t partisan noise. It’s signal. JP Morgan’s analysts wrote this week that the gap between Americans with significant stock market holdings and those without has reached a record width. The top forty percent, insulated by portfolios weighted toward AI stocks and specialized sectors, experienced the war with Iran as a temporary dip followed by a satisfying rebound. The bottom sixty percent experienced it as a gas price spike stacked on grocery inflation stacked on three years of prices that never came back down after the pandemic.
These aren’t two opinions about the same economy. They’re two experiences of two different economies that happen to share a name.
The easy version of this column would stop there. Rich people are fine, everyone else isn’t, the market is a fiction. But the easy version leaves out things that matter.
The stock market is not only rich people. More than half of American households own stocks, directly or through retirement accounts. A 401(k) isn’t Wall Street. It’s a schoolteacher’s retirement. A firefighter’s savings. When the market recovers, that recovery touches real lives too, even if it doesn’t feel like it when those same lives are also paying four dollars and eighty cents for a gallon of gas.
And the sentiment survey has its own problems. It has become, over the past decade, increasingly responsive to partisan identity. When your party holds the White House, you feel better about the economy. When it doesn’t, you feel worse. This is documented. It doesn’t make the survey useless, but it means the number includes some signal and some noise, and separating the two has gotten harder.
What stays true after you account for the complications is this: the American economy has been producing two stories for a long time now. One story shows up in market indices, GDP growth, and employment statistics that look solid at the national level. The other story shows up in kitchens, in the cost of a family health insurance premium, in the reason a twenty-eight-year-old can’t buy a house, in the reason a sixty-five-year-old is still working and not because she wants to be.
Both stories are accurate. Neither one is a lie. The question has never been which story is true.
I grew up in a town where the economy was one thing. It was the plant. Everybody’s father worked there or knew someone who did. The stock market existed, but it existed the way weather in Paris existed: real, but not relevant to what was happening on your street. If the plant was running, times were decent. If the plant laid off a shift, times were not.
That world is gone and isn’t coming back, and I’m not arguing it should. But something has replaced it that we haven’t fully reckoned with. We now live with an economy so large and so layered that two measurements of it can point in opposite directions and both be correct. A record high and a record low in the same week, and neither one is wrong.
The question isn’t which number to believe. It’s which number leads the story. Which number shapes the political conversation. Which number decides whether the economy is “good” or “bad” in the way we talk about it over dinner, in the way candidates talk about it from podiums, in the way editors decide what goes on the front page.
That isn’t an economic question. It’s an editorial one. It’s a choice about whose experience counts as the real one.
This week, the market story led. It usually does. The 47.6 made news for a day and then slipped behind the rally. That isn’t a conspiracy. It’s a habit. And habits, when you follow them long enough, will tell you who a system was built for.
But here’s what the habit misses: a number like 47.6 means that millions of people, across every category the survey can identify, are trying to describe a feeling that the headline number can’t contain. They aren’t saying the economy is broken. They’re saying the economy they live in doesn’t match the one they keep hearing about. That feeling isn’t partisan. It isn’t irrational. It’s the lived experience of watching two screens at once and seeing two different movies.
Noticing that is the first thing. Whether we do anything about it is a different question entirely. But it helps, I think, to name the thing clearly. Two numbers. One country. Same week. And nobody is wrong.